An accident-risk model rebuilt after finding its label was leaking.
Found that the popular “accident severity” label mostly tracked which traffic feed filed the report, then rebuilt an honest model on 3.2 million accidents from one consistent feed, explained it, and made it run entirely in the browser.
- Sector
- Transport
- Method
- Explainable ML
- When
- Dec 2025 – Oct 2026
- Context
- MSc AI coursework, rebuilt independently
- Role
- Solo: data audit, modelling, explainability and the web app
Key figures
- 0.852 ROC-AUC on later, unseen months
- 0.184 average precision against a 2.78% base rate
- 0.0026 calibration error
How it works
- Audit : The old label tracked which feed filed the report
- Reframe : One consistent feed and inputs known at report time
- Split : Tune on earlier months, test once on the last six
- Benchmark : Eight models with the same tuning budget
- Calibrate and explain : Calibrated LightGBM with TreeSHAP reasons
- Export : Trees and lookup tables packed for the browser
- Report : A real test-month accident, or your own changes
- Features : The training features, from the exported lookups
- Score : LightGBM's trees, ported to TypeScript
- Calibrate : The chance of a major impact on traffic
- Explain : Exact TreeSHAP: what raised or lowered the risk
Architecture and results
- A model runs here
- Deterministic code
- An outside source
- A stored artefact
- A boundary the design refuses
-
Built once in Python, run in the browser
The model is built once in Python and runs in the visitor's browser with no server. LightGBM's trees and the lookup tables are exported, then a TypeScript port scores each report and computes exact TreeSHAP reasons, matching Python to within 1e-6. The report's free-text description is refused as an input: on its own it reaches an average precision of 0.481, because it nearly states the label.
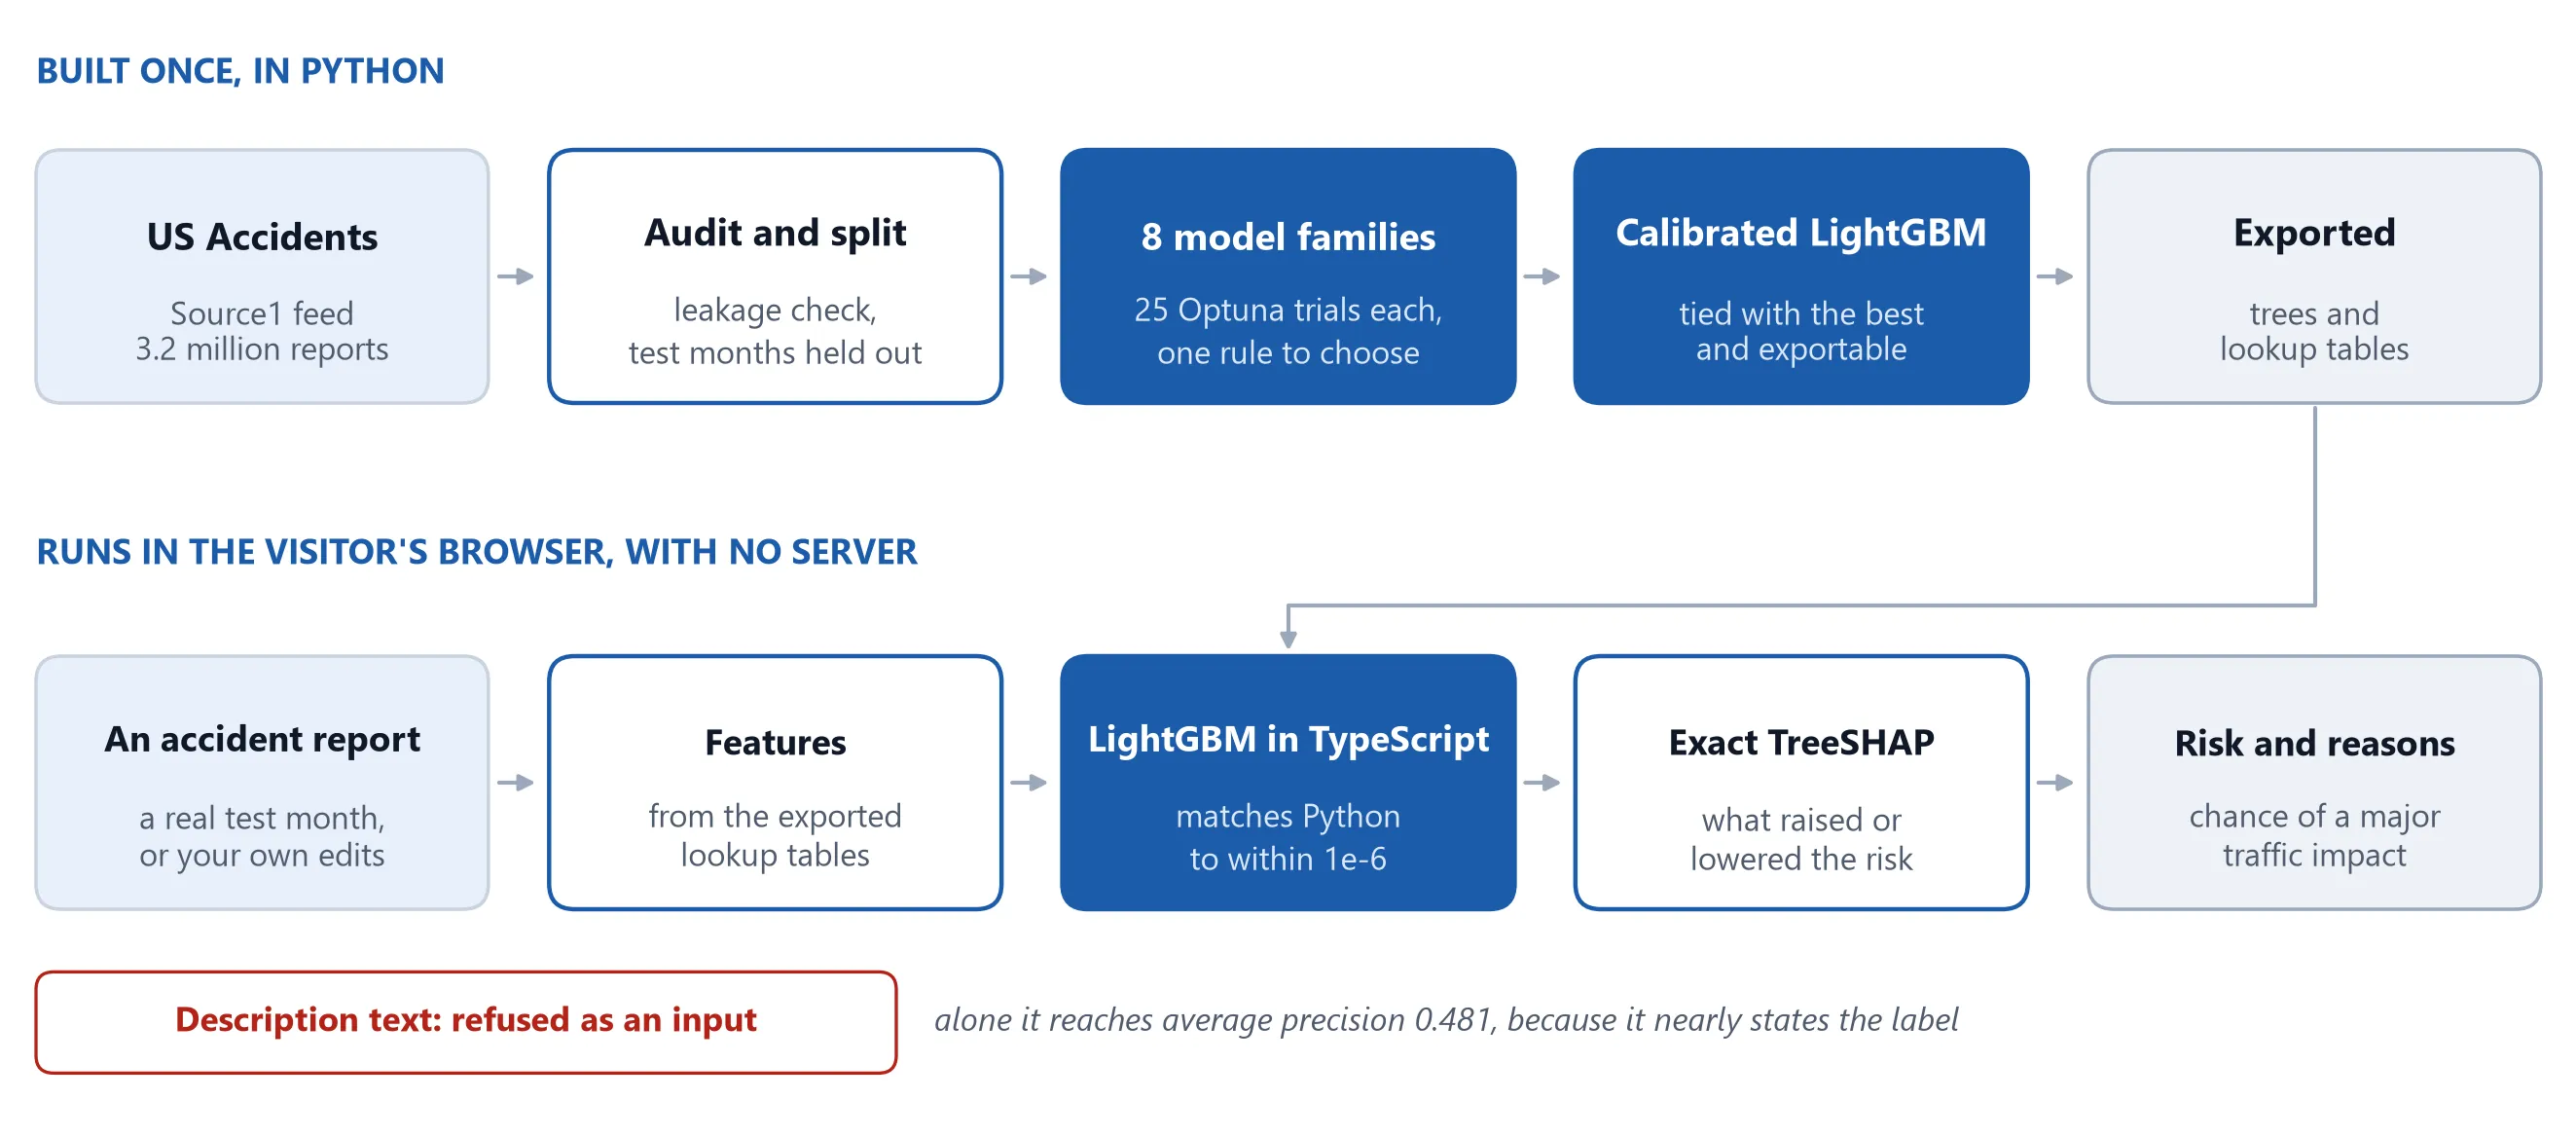 Open full size: Built once in Python, run in the browser
-
The old label tracked the reporting feed
In the earlier project's window, the share of reports labelled Severity 3 or 4 depended on which traffic feed filed them, not on the roads. A model of that label mostly learns the feed, so the rebuild models one consistent feed only.
-
Eight model families, tied at the top
Each family started from library defaults and had 25 Optuna trials on the same rows. On the validation months, TabM, LightGBM, CatBoost and XGBoost are statistically tied, so LightGBM, which can run in a browser, costs no measurable accuracy. The darker bar is the shipped model.
Numbers from the project's public repository (the README and notebooks 02 and 05).
The question
When a traffic accident in the US is first reported, how likely is it to have a major impact on traffic? The answer may use only what is known at that moment: the place, the time, the weather and the road. In this dataset, “severity” measures the effect on traffic flow, not injuries.
The usual label was measuring the wrong thing
The dataset’s severity label looks like a ready-made target, but an audit showed it mostly records which traffic feed filed the report. One feed marks 2.8% of its accidents as Severity 3 or 4; another marks 34.7%; and the mix of feeds changes over time. Keyword flags taken from the description text identify the feed with ROC-AUC 0.915.
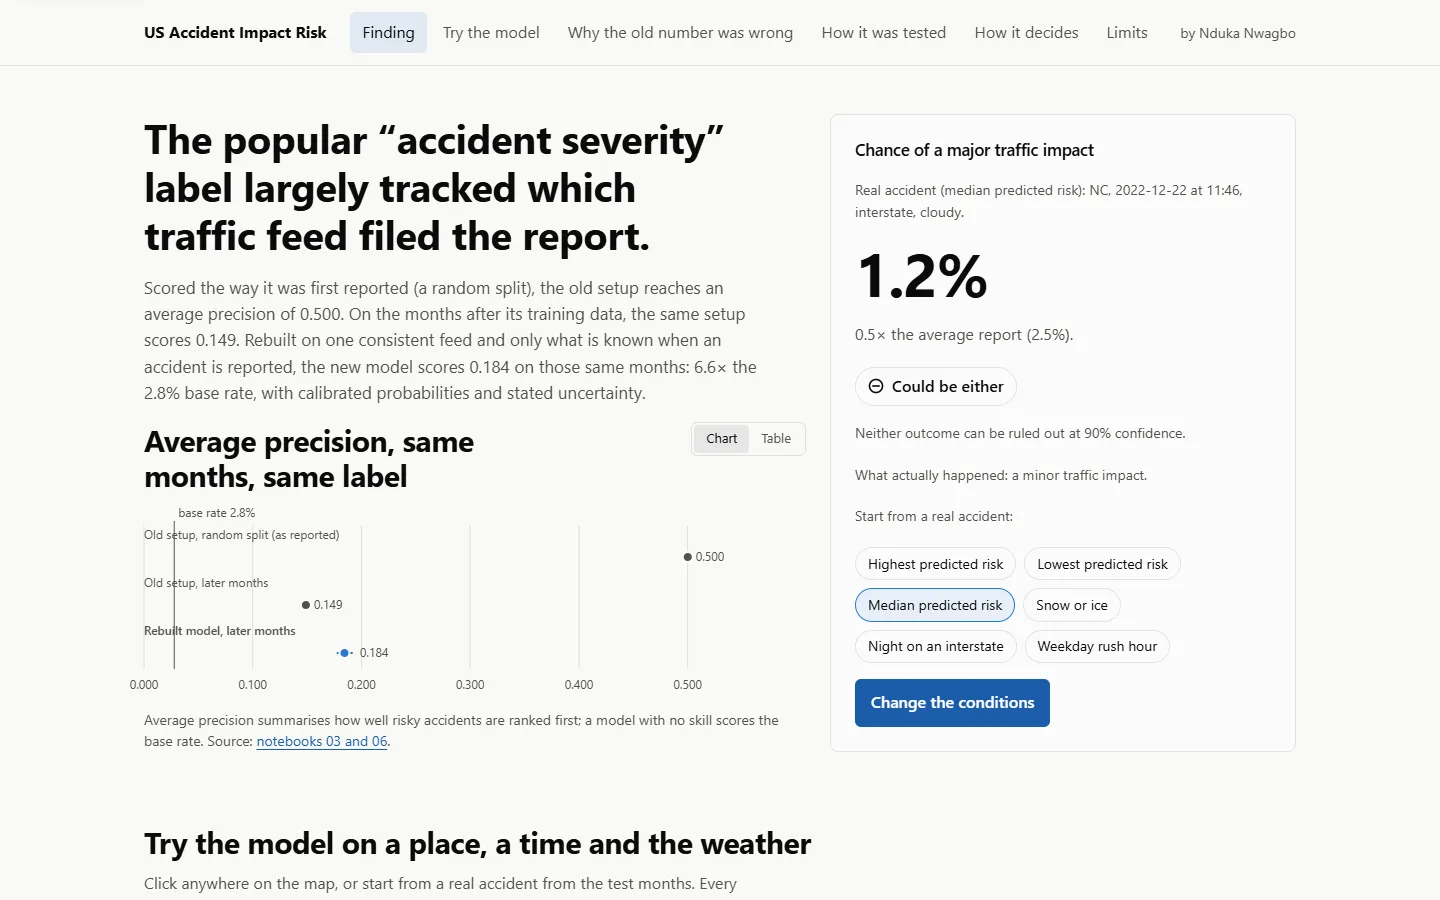
An earlier version of this project fell into that trap. Scored on a random split, it reached an average precision of 0.500. The same setup scores 0.149 on later months.
An honest rebuild
- One consistent feed. Source1 labels every report from October 2020 to March 2023 on the same scale: 3,242,942 accidents, 2.56% of them Severity 4.
- Only what is known at report time. The description text is left out: on its own it reaches an average precision of 0.481, because it nearly states the label.
- A split by time. Training runs from January 2021 to March 2022, validation from April to September 2022, and the test covers October 2022 to March 2023. The test months were scored once, after the model, its calibration and its thresholds were frozen.
- A fair benchmark. Eight models, from a prior-only baseline to TabM, each started from library defaults and had 25 Optuna trials on the same rows. The rule for choosing one was written before any scores.
- Honest uncertainty. The 95% intervals resample whole days, because accidents on the same day share weather and traffic.
Results
On the six test months, the shipped model, a calibrated LightGBM, reaches an average precision of 0.184 (95% interval 0.178–0.191) against a base rate of 2.78%, a ROC-AUC of 0.852 and a calibration error of 0.0026. TabM, LightGBM, CatBoost and XGBoost are statistically tied, so running the model in the browser costs no measurable accuracy.
Place carries most of the signal, partly because agencies report closures differently. The explanations say so, instead of presenting it as road risk.
Why it runs in the browser
The dashboard ports LightGBM’s tree traversal and exact TreeSHAP to TypeScript, tested to match Python to within 1e-6. With no server, there is no cold start. Visitors start from a real accident in the test months, change its place, time, weather or road, and watch the risk and its reasons change.
Limits
- An average precision of 0.184 is more than six times the base rate, but far from certain: the score ranks reports for attention; it does not predict individual outcomes.
- It covers one feed’s reports from October 2020 to March 2023. Other feeds label differently.
- Some of what looks like the effect of place is how local agencies report closures.
- The data licence is CC BY-NC-SA 4.0, so the model and its lookup tables are for non-commercial use with attribution.
Built with
Data from the US Accidents dataset (Moosavi et al., 2019), CC BY-NC-SA 4.0.