Open-data evidence for a winning plan to reconnect a city district.
The evidence toolkit behind The Innovation Spine, a team proposal to reconnect Birmingham's Knowledge Quarter to the city centre. Route legibility scoring, wayfinder placement, traffic and collision evidence and a costed plan, shipped as an interactive map.
- Sector
- Urban planning
- Method
- Geospatial analytics and optimisation
- When
- Jun 2026
- Context
- Team entry: West Midlands winners, UKREiiF 2026 Next-Gen Challenge
- Role
- Built the open-data evidence toolkit and the web app
Key figures
- 86% of 4,000 random weightings keep the top route
- 12 wayfinders placed by a coverage optimiser
- £693k indicative cost after sponsorship, inside £1M
How it works
- Acquire : Open data: OSM, DfT traffic and collisions, NaPTAN, Land Registry
- Audit : Every source tagged on an evidence ladder from 0 to 5
- Model : Route legibility, wayfinder coverage, crossing and pavilion
- Cost : Low, central and high estimates against £1M
- Sanitise : A build check stops internal notes reaching the app
- Publish : A static map app on Cloudflare Pages
Architecture and results
- A model runs here
- Deterministic code
- An outside source
- A stored artefact
- A boundary the design refuses
-
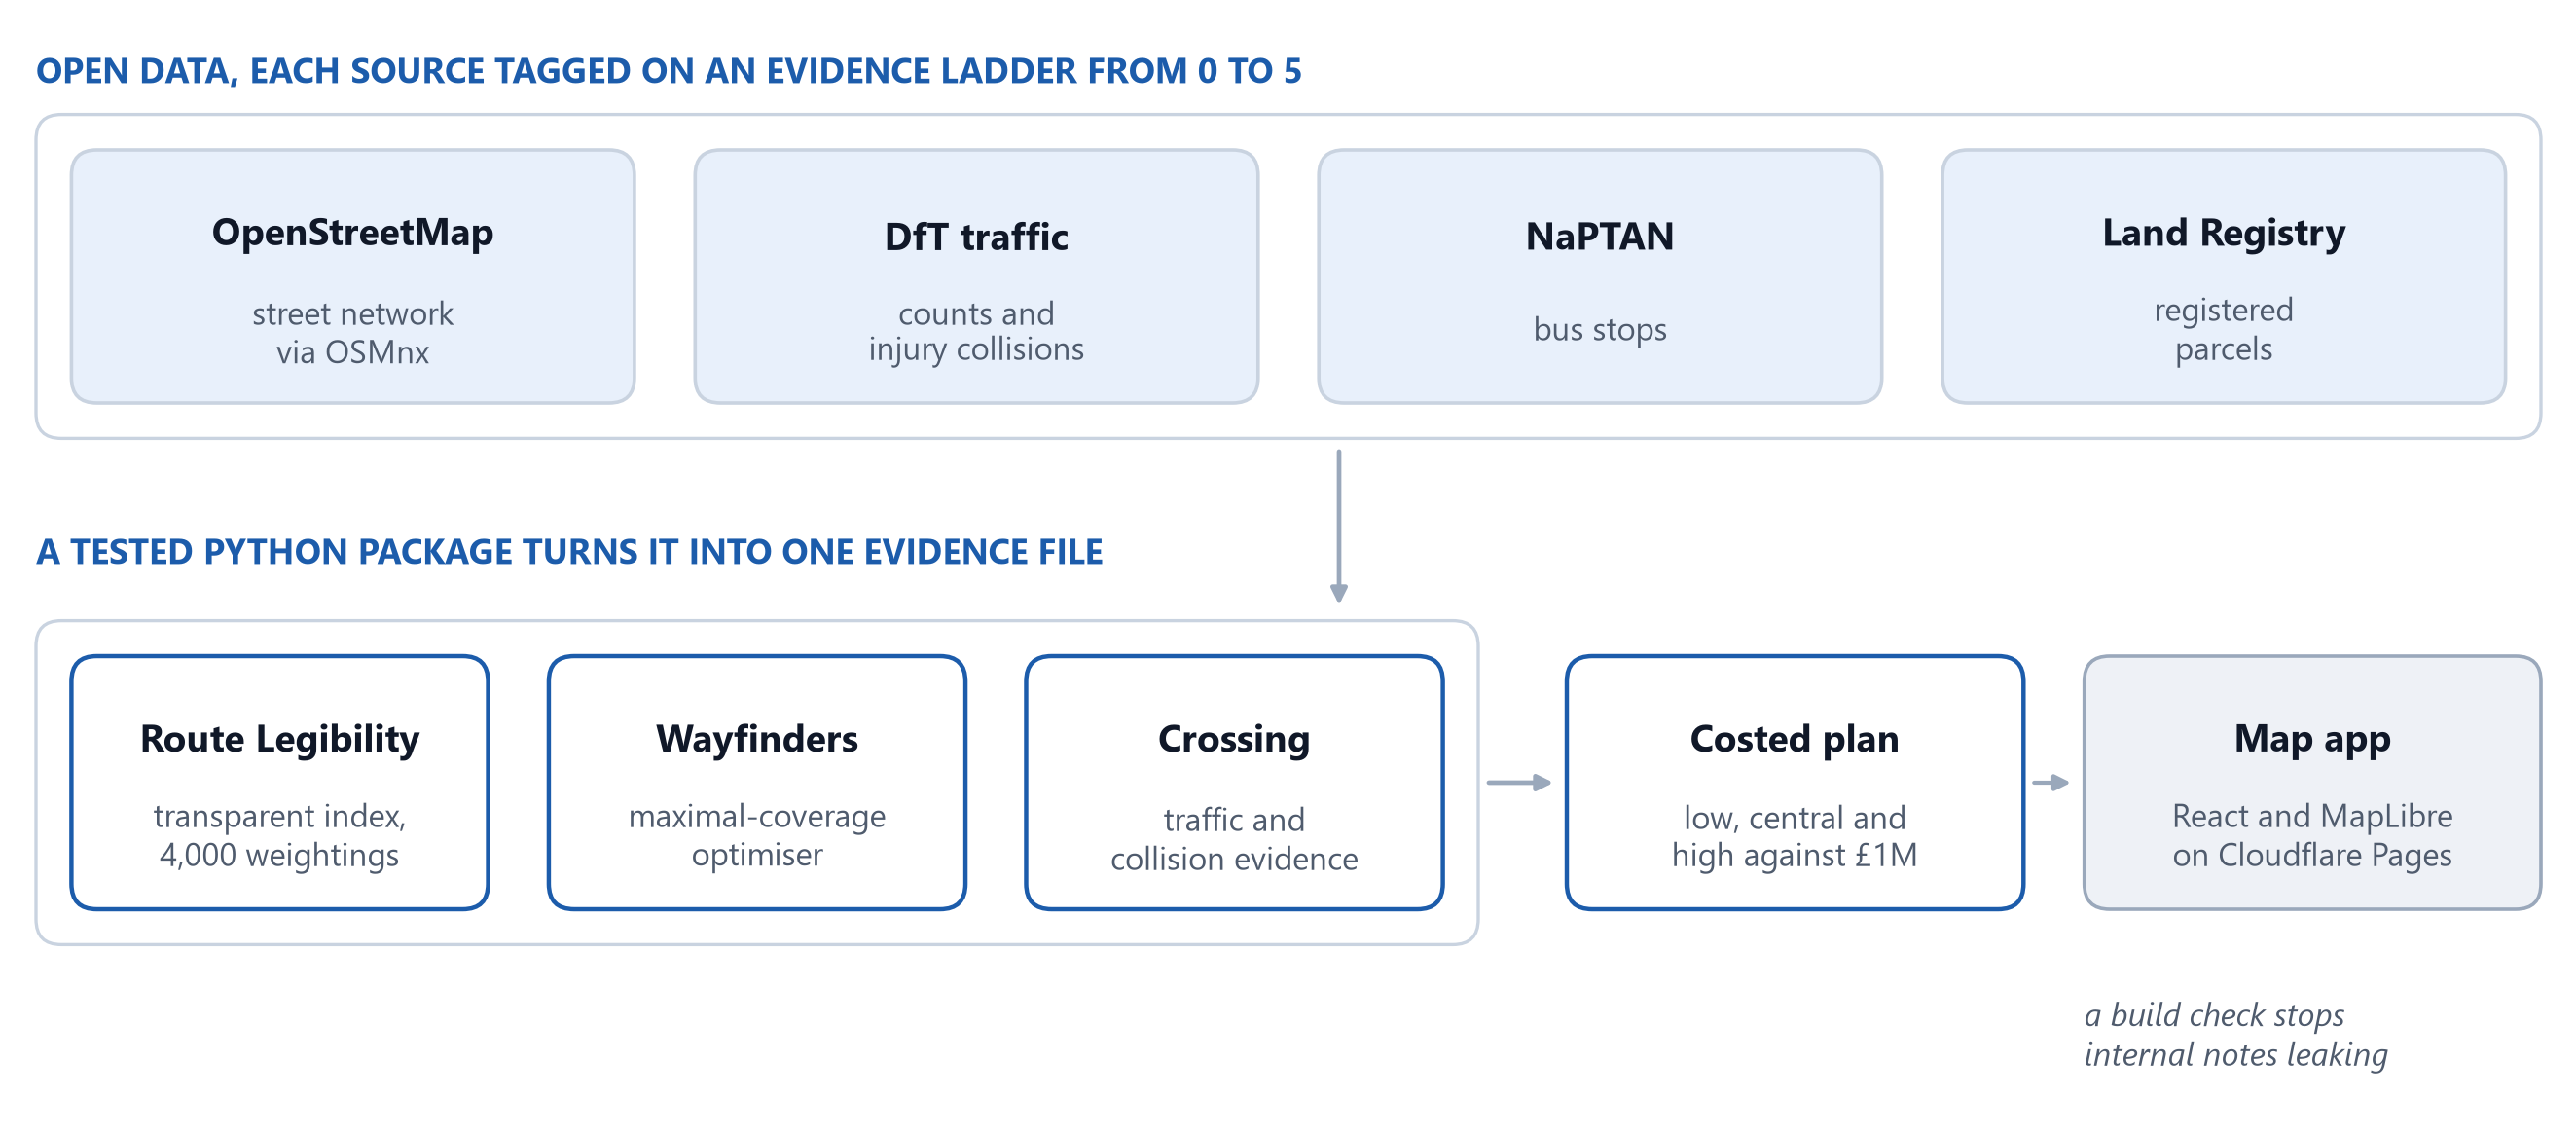
Open data to a public map, with no model in the loop
Four open sources, each tagged on an evidence ladder, feed a tested Python package. Three independent analyses, route legibility, wayfinder placement and the crossing, feed one costed plan, and a build step turns the evidence file into a static map app, failing if internal notes would leak. Everything is transparent scoring and optimisation.
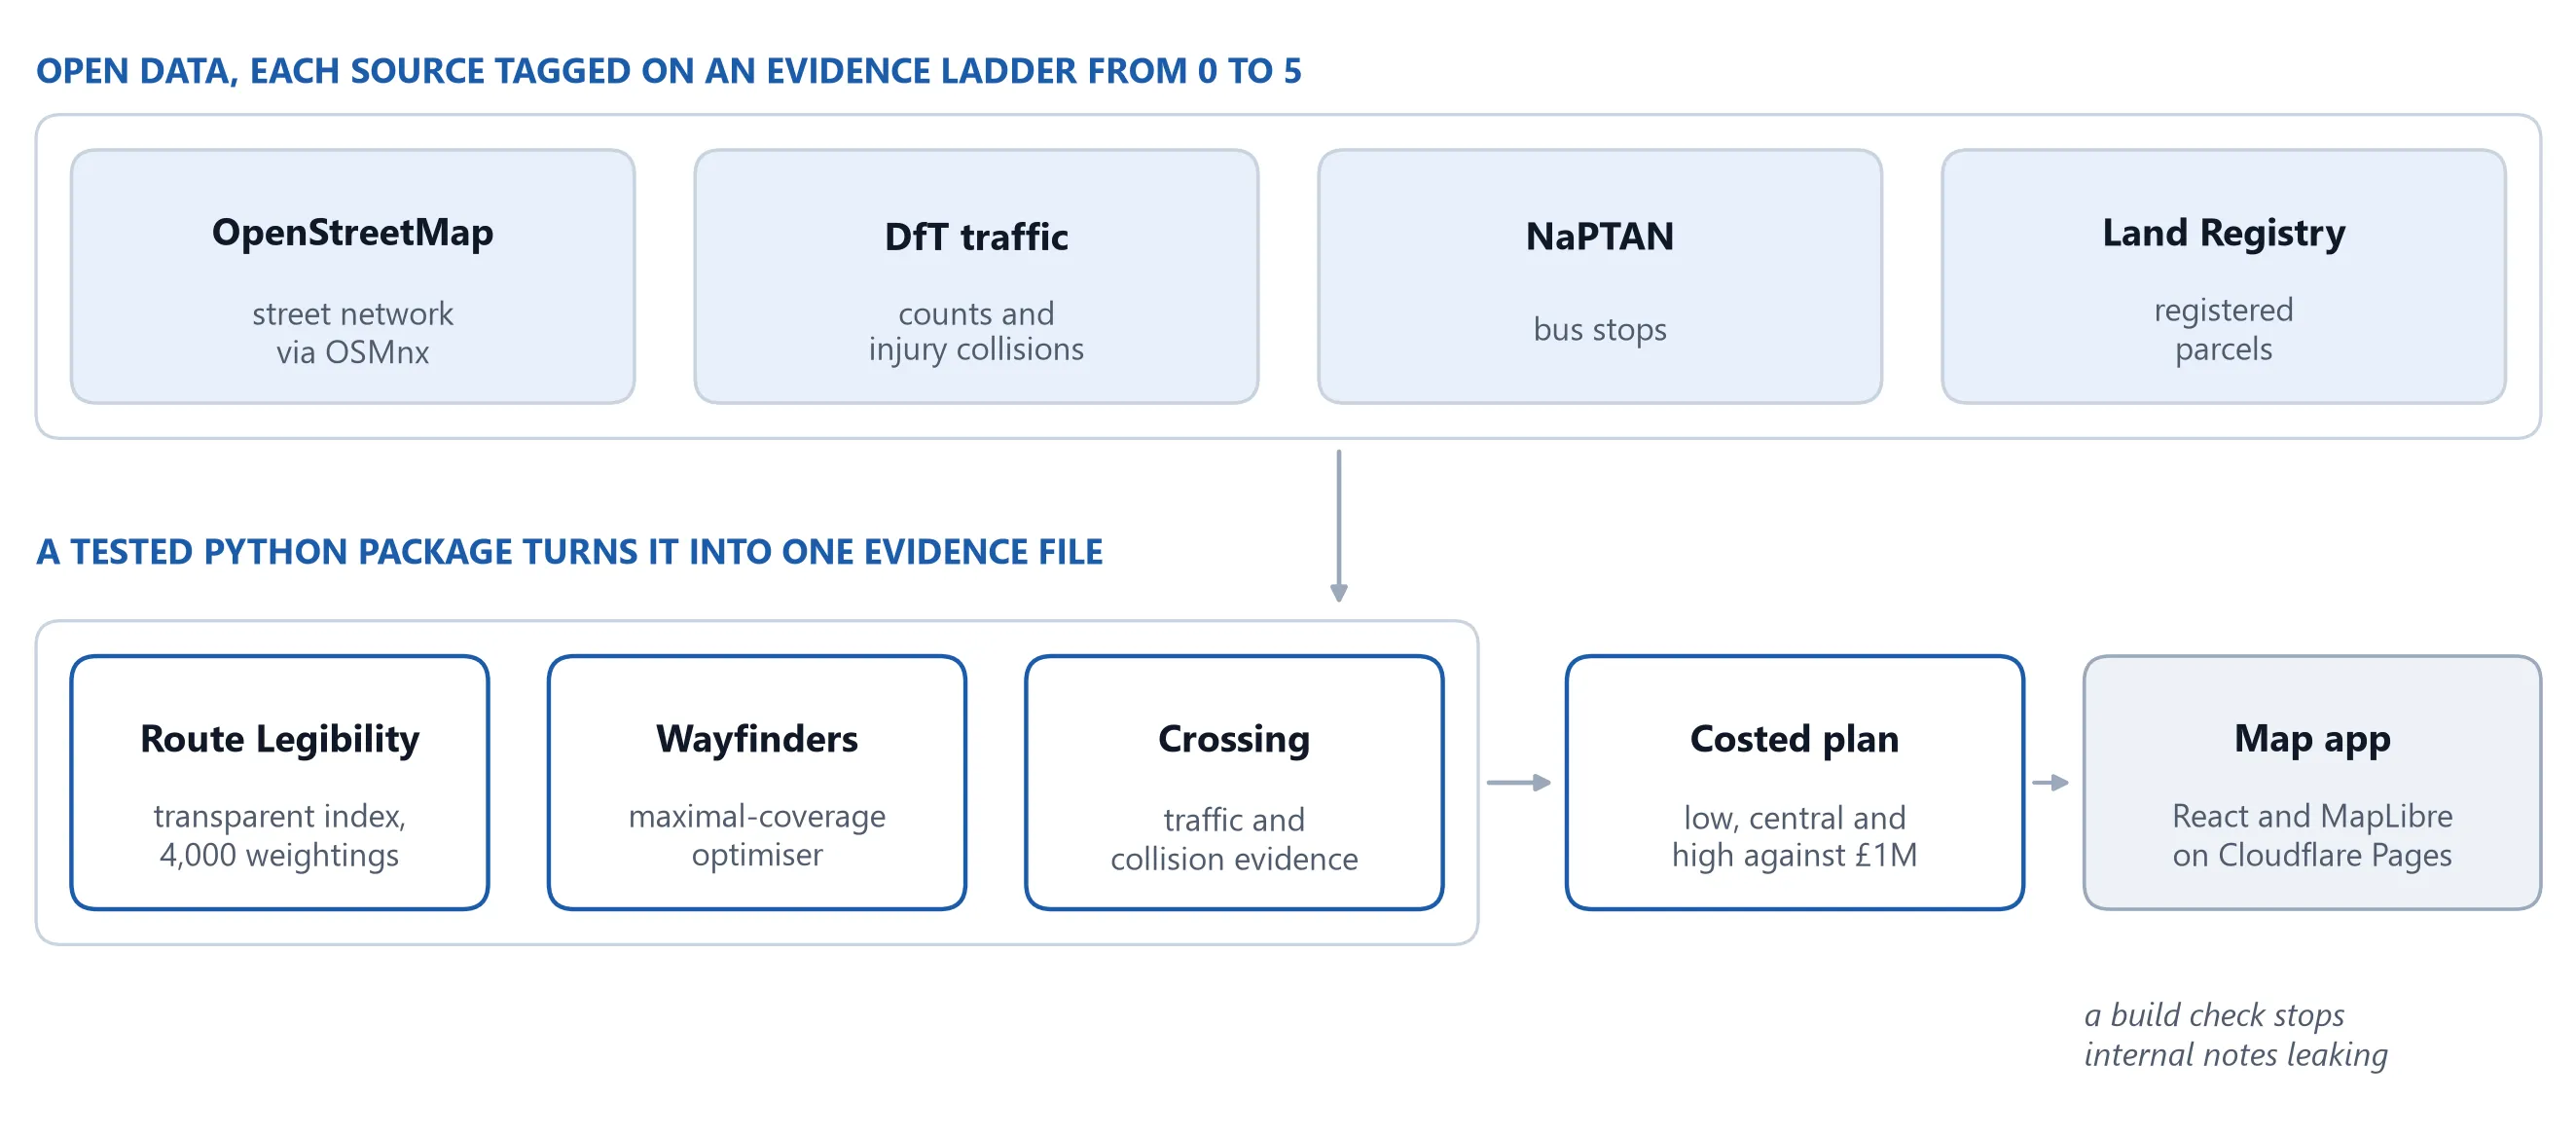 Open full size: Open data to a public map, with no model in the loop
-
How often each approach ranks most legible
The Route Legibility Index was re-run with 4,000 random weightings of its components. Colmore Row ranked most legible in 86% of them, so the ranking does not hang on one choice of weights.
Numbers from the project's public repository (README and route-legibility outputs).
The question
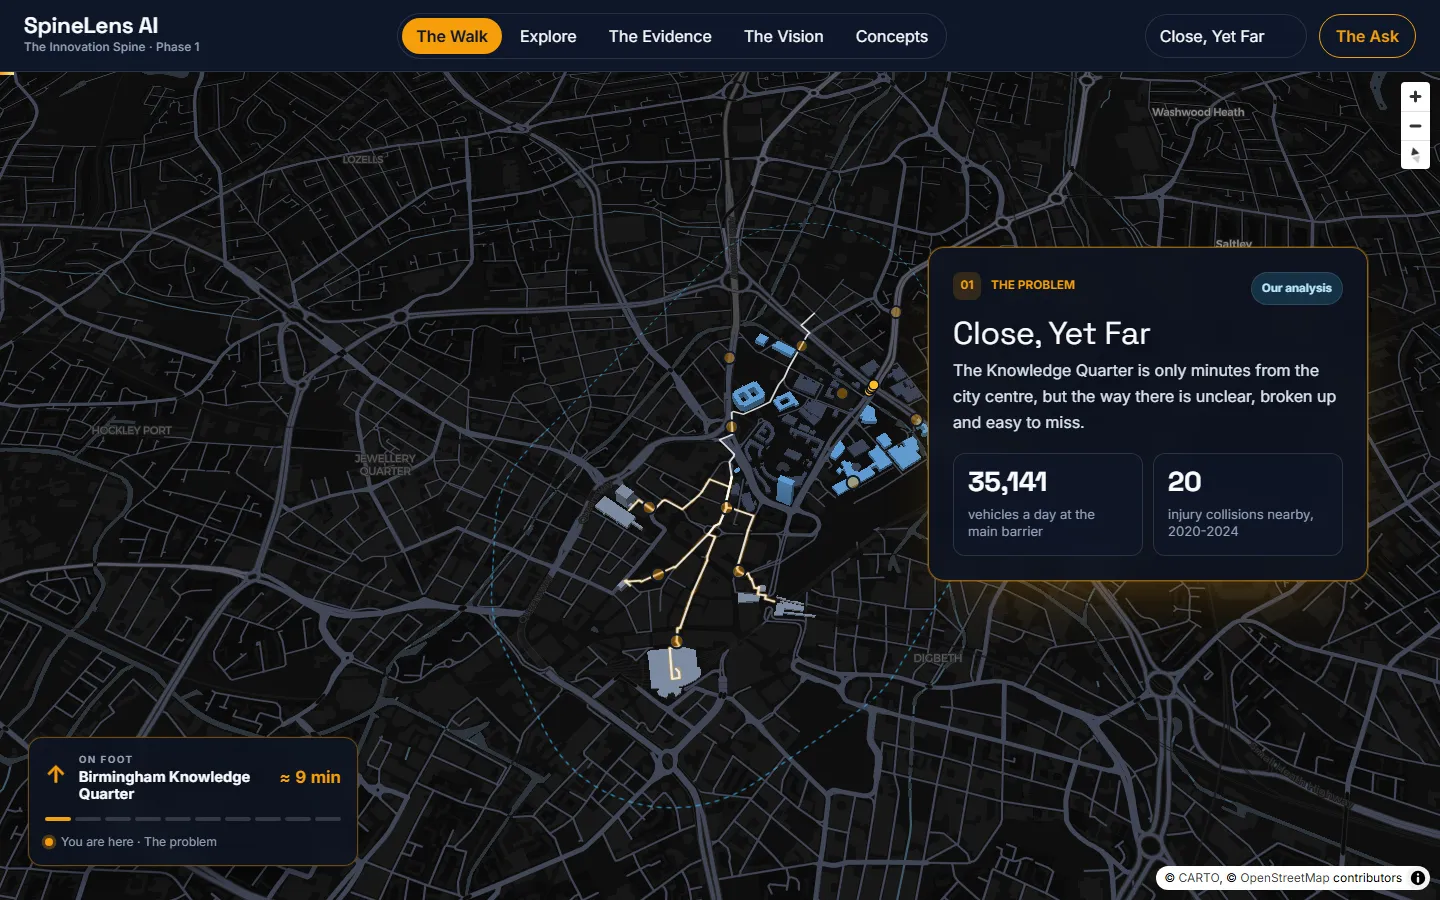
Birmingham’s Knowledge Quarter, home to Aston University, BCU and Millennium Point, is minutes from the city centre but cut off by wide, fast roads and by routes that tell a pedestrian nothing. For the UKREiiF 2026 Next-Gen Challenge, our team proposed The Innovation Spine. The question for its first, £1M phase: where does the walk become hard to follow, and which low-cost changes make it clearer per pound? My part was the open-data evidence behind the answer and the web app that presents it.
Evidence, with its level stated
Every output is tagged on an evidence ladder from 0, not tested, to 5, validated in the field. Most of this work sits at level 3, audited, and nothing is presented as funding-grade.
What the evidence found
- Route legibility. A transparent Route Legibility Index ranks the approaches: Colmore Row reads clearest, Snow Hill hardest. Re-run with 4,000 random weightings, Colmore Row stays first in 86% of them, so the order does not hang on one choice of weights.
- The crossing. Dartmouth Middleway carries 35,141 vehicles a day but 43 cyclists, with 20 injury collisions, 5 of them serious, within 150 m between 2020 and 2024. That supports a signalised crossing rather than paint.
- Wayfinders. A maximal-coverage optimiser places them where people can take a wrong turn. About seven cover roughly 90% of the city-centre confusion, and twelve once the network extends across the crossing.
- The pavilion. A reversible wooden information hub, matched by Land Registry data to a single registered parcel.
- The budget. At the central estimate the whole package fits the £1M phase, at about £693,000 after sponsorship. The high estimate does not fit, and the chart keeps that visible.
From notebooks to a public app
The work runs in three layers. Notebooks and a tested Python package produce one evidence file. A build step turns it into the app’s content and fails if internal notes or source codes would leak. A static React and MapLibre app presents it in five views, tested for WCAG 2.2 AA, on Cloudflare Pages at no running cost.
Limits
- The scores are transparent hypotheses on documented weights, not measured outcomes.
- All costs are indicative until a quantity surveyor prices them. Fieldwork, costing and consents are listed in a validation register with owners and next steps, but are not done.
- This covers Phase 1 only; the £10M and strategic phases are proposals.
- The code has no licence yet, so it is not open for reuse.
Built with
Map data © OpenStreetMap contributors; traffic and collision data from the Department for Transport.